Configure Elastic Stack for Central Logging
After you configure the log4net appenders, install and configure Elastic Stack to pull data from FileBeat.
To configure Elastic Stack:
-
Install Elastic Stack version 7.14, as explained in this official Elastic doc: https://www.elastic.co/guide/en/elastic-stack-get-started.
-
If Elasticsearch is installed outside the New Job Scheduling Kubernetes cluster, ensure connectivity between Elasticsearch and the cluster.
-
Install FileBeat version 7.14 as explained in this official Elastic doc: https://www.elastic.co/guide/en/beats/filebeat/current/running-on-kubernetes.html. FileBeat allows the transmission of logs from the Kubernetes-based New Job Scheduling services to Elastic Stack.
ImportantMake sure to specify your Elasticsearch host and username/password in the
filebeat-kubernetes.yaml. -
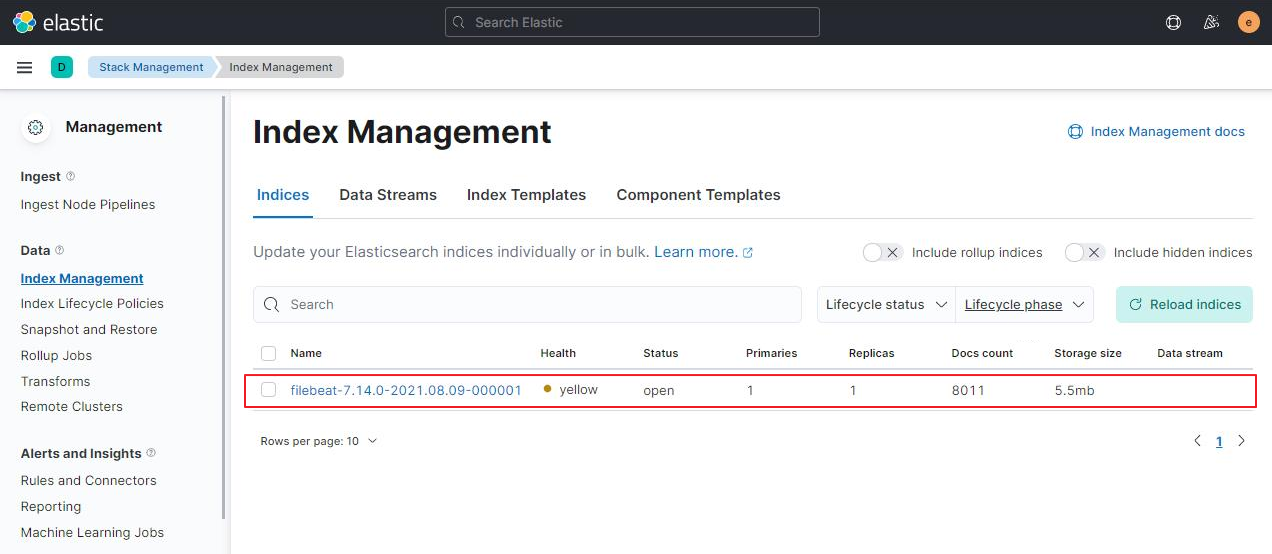
In the Elastic application, go to Manage>Index Management and make sure some log data has been collected.

-
Define an index pattern.
-
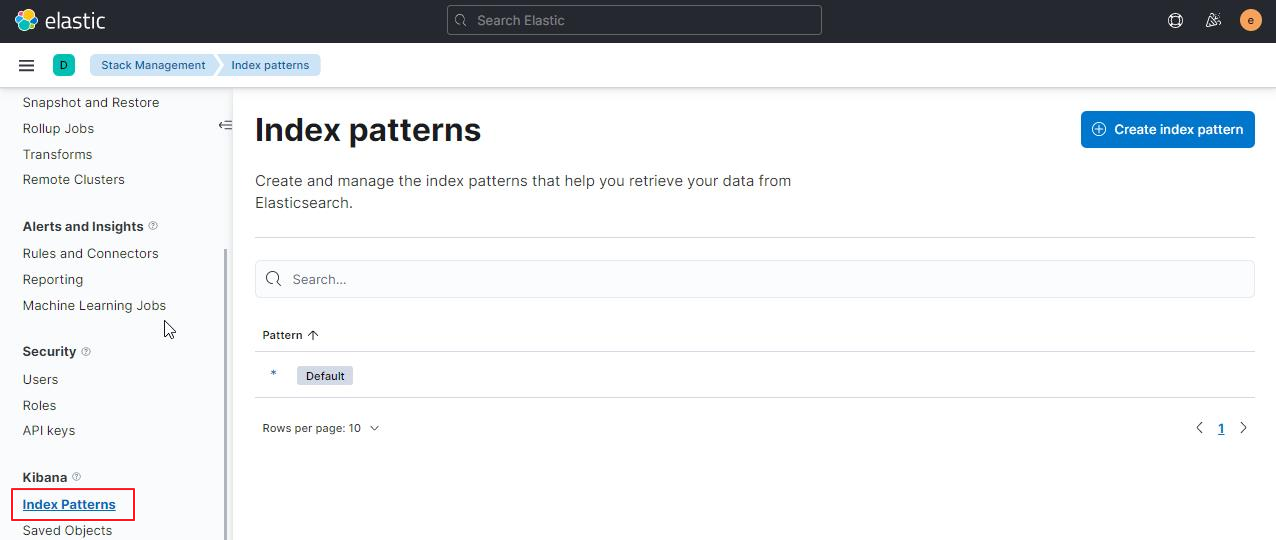
Scroll down to Kibana, click Index Patterns and then click Create index pattern:

-
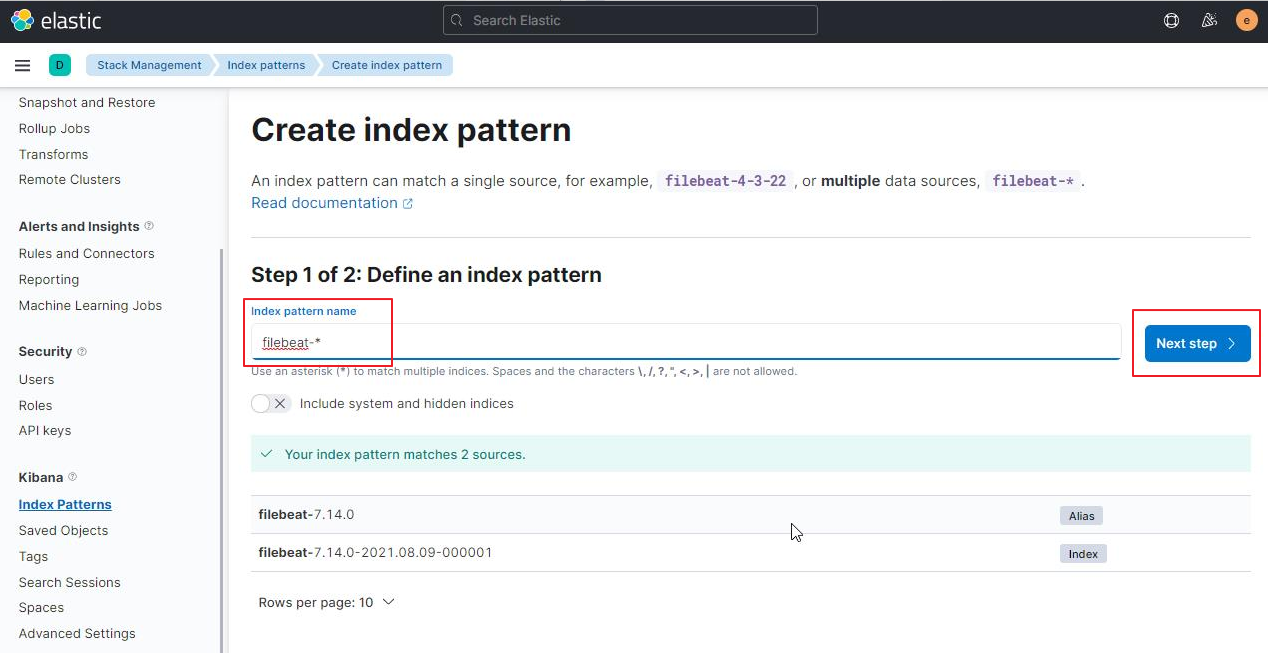
In the Index pattern name field, specify filebeat-* and click Next step.

-
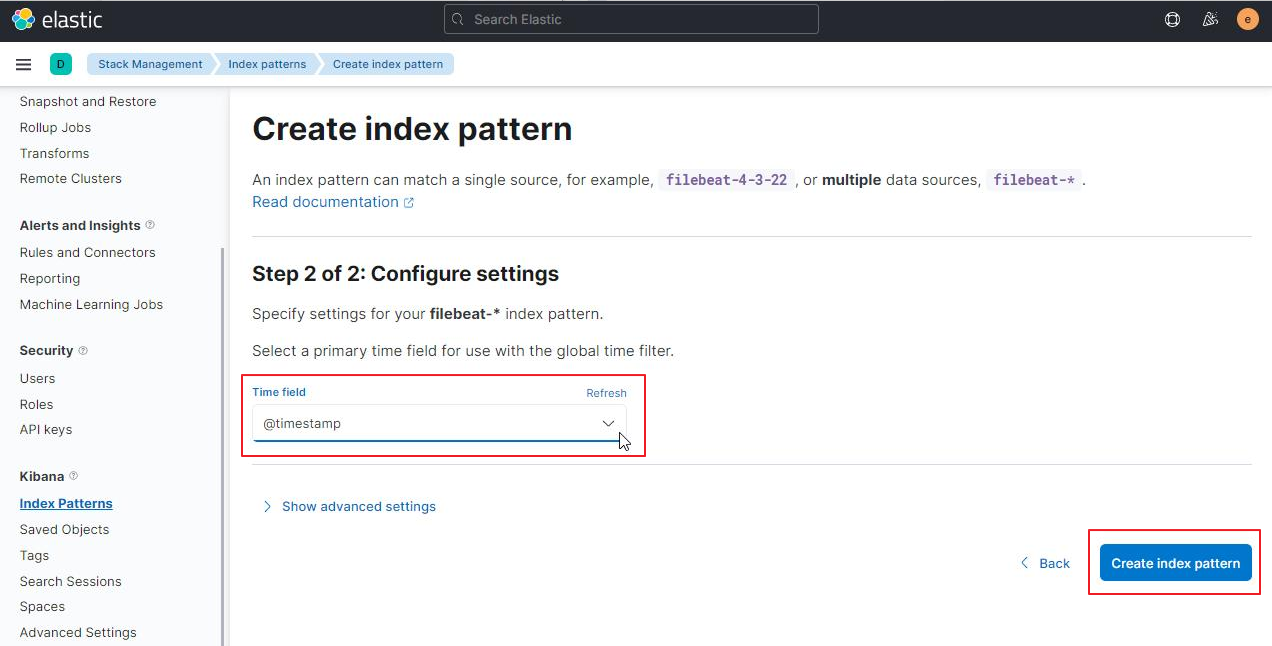
Select @timestamp from the Time field dropdown list and click Create index pattern.

This concludes the Elastic Stack integration with CloudShell. At this point, CloudShell log data should be properly displayed in Elastic Stack. For details about consuming log data, see this official Elastic doc: https://www.elastic.co/guide/en/kibana/current/discover.html.
-