How to Track Event Threads Using Trace ID or Reservation ID
This tracking capability is provided as part of Central Logging Configuration.
CloudShell logs traditionally reside in different locations. As a result, the same CloudShell user flow (like a sandbox or resource execution) can be recorded in different logs, each addressing a different aspect of the user flow and complicating matters for the user reading the files. For example, if Job Scheduling Service executes a job suite, it will need a sandbox, so it calls sandbox service, which calls Quali Server, which in turn calls Execution Server. This entire thread, with requests and responses will have a common thread ID, which can be used to follow user flows through the system.
Main thread IDs
- reservationid for sandbox deployments
- traceId for the New Job Scheduling
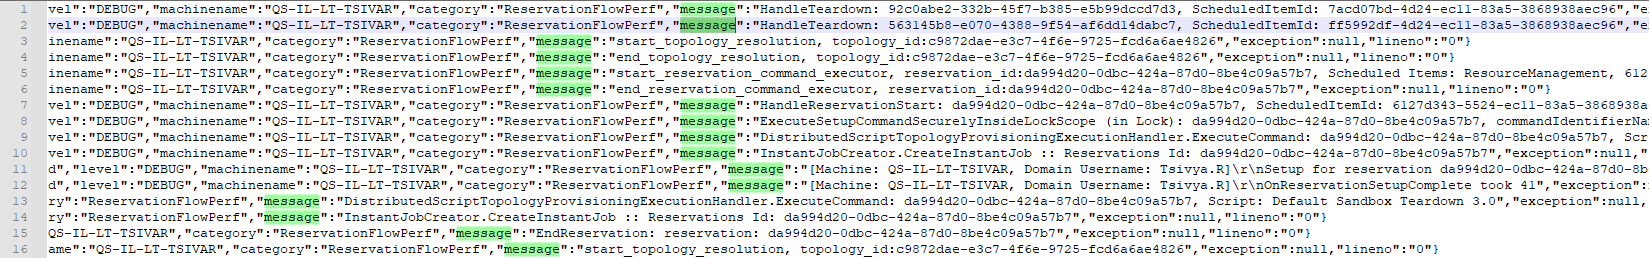
For example:
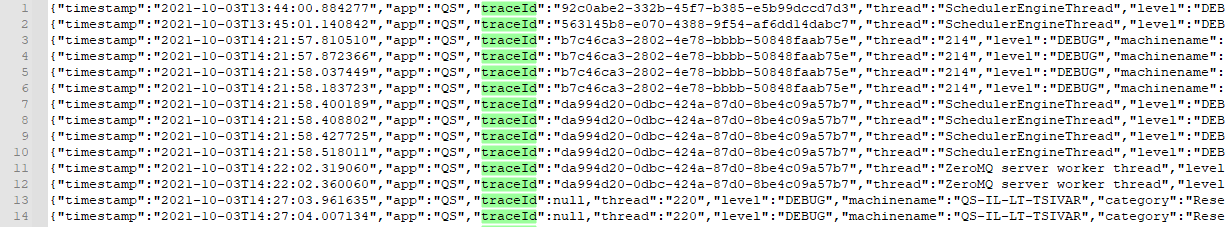
Some logs are "internal”. In other words, they don’t originate from another service and therefore will either have a unique trace id, maybe even "null". This simply means that these logs are not part of a sequence of calls between different services.
Log parameters
{ "timestamp": "2021-09-01T13:27:49.529566", "app": "JSS", "traceId": "f96f3dce7c59f549aba7d55b21b4daa7", "threadId": "10", "level": "DEBUG", "machineName": "job-scheduling-service-556cc88484-5gf4t", "category": "Quali.CloudShell.Job.Scheduling.Api.TestExecutionManagement.SandboxExecutionHandler", "message": "Attempting to update test result for test execution id: c3892e15-6b2f-473a-a60f-d2f033d17fbb" }
-
Timestamp: when the log was taken
-
App: what component of our architecture took the log
-
Traceid: (applies to New Job Scheduling flows) UUID that is generated when a process calls another process. For example when JSS orders a new sandbox, it passes the request to sandbox service which passes the request to Quali Server. This request will share a traceid.
Trace ID allows you to follow an action that involved several components such as launching a job and creating a reservation it is useful to see how that request was handled in different components
-
Reservationid: (Applies to sandbox lifecycle flows) UUID of the sandbox
-
Threadid: internal thread in the component. Useful for debugging. Represents the internal thread of the process where the logging occurred
-
Level: log level
-
Machinename: name of host or container that took the log
-
Category: log category. This is a developer tool used internally to describe what general area of code logged the message.
-
Message: message of the log. For example:
Tracking an events thread
For illustration purposes, the following procedure assumes you're using Elastic Stack to get a log thread related to a trace id, but you can use your preferred log management tool.
To track an events thread:
- In Elastic Stack, open the Discover or Logs page.
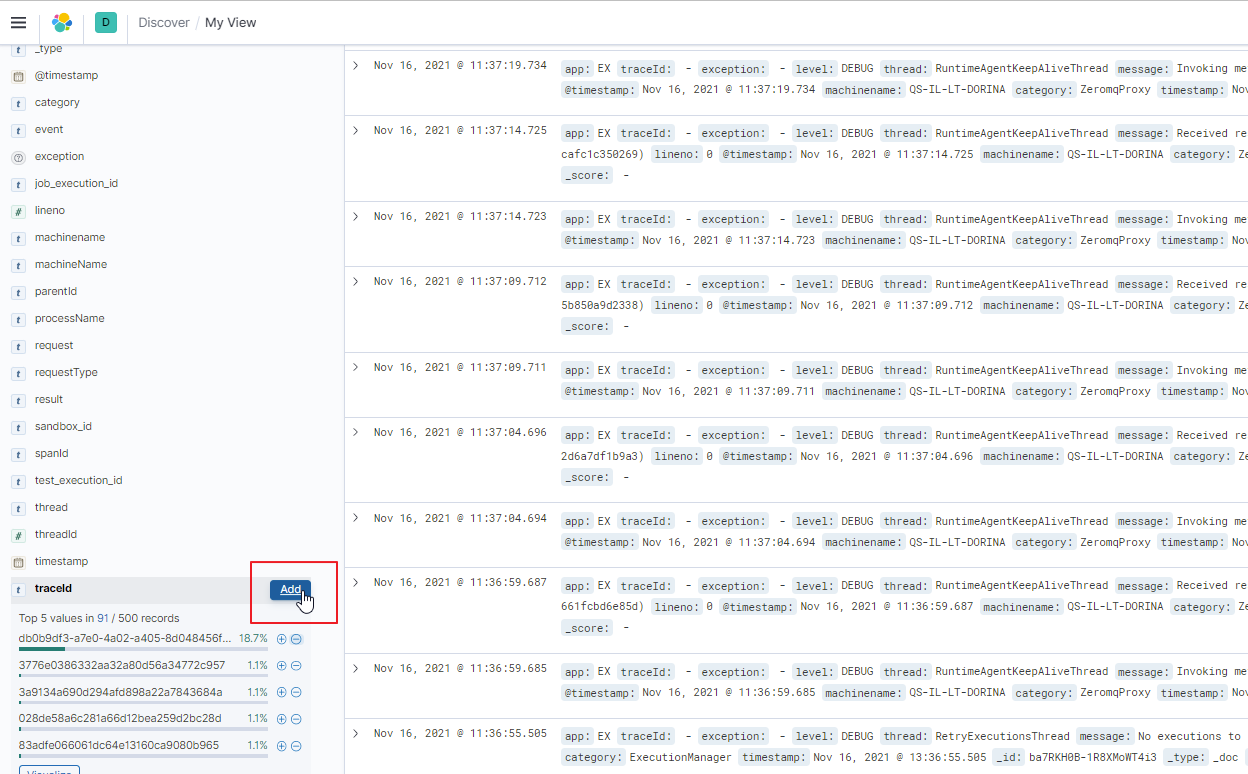
- Add the traceId column to the table.
More...
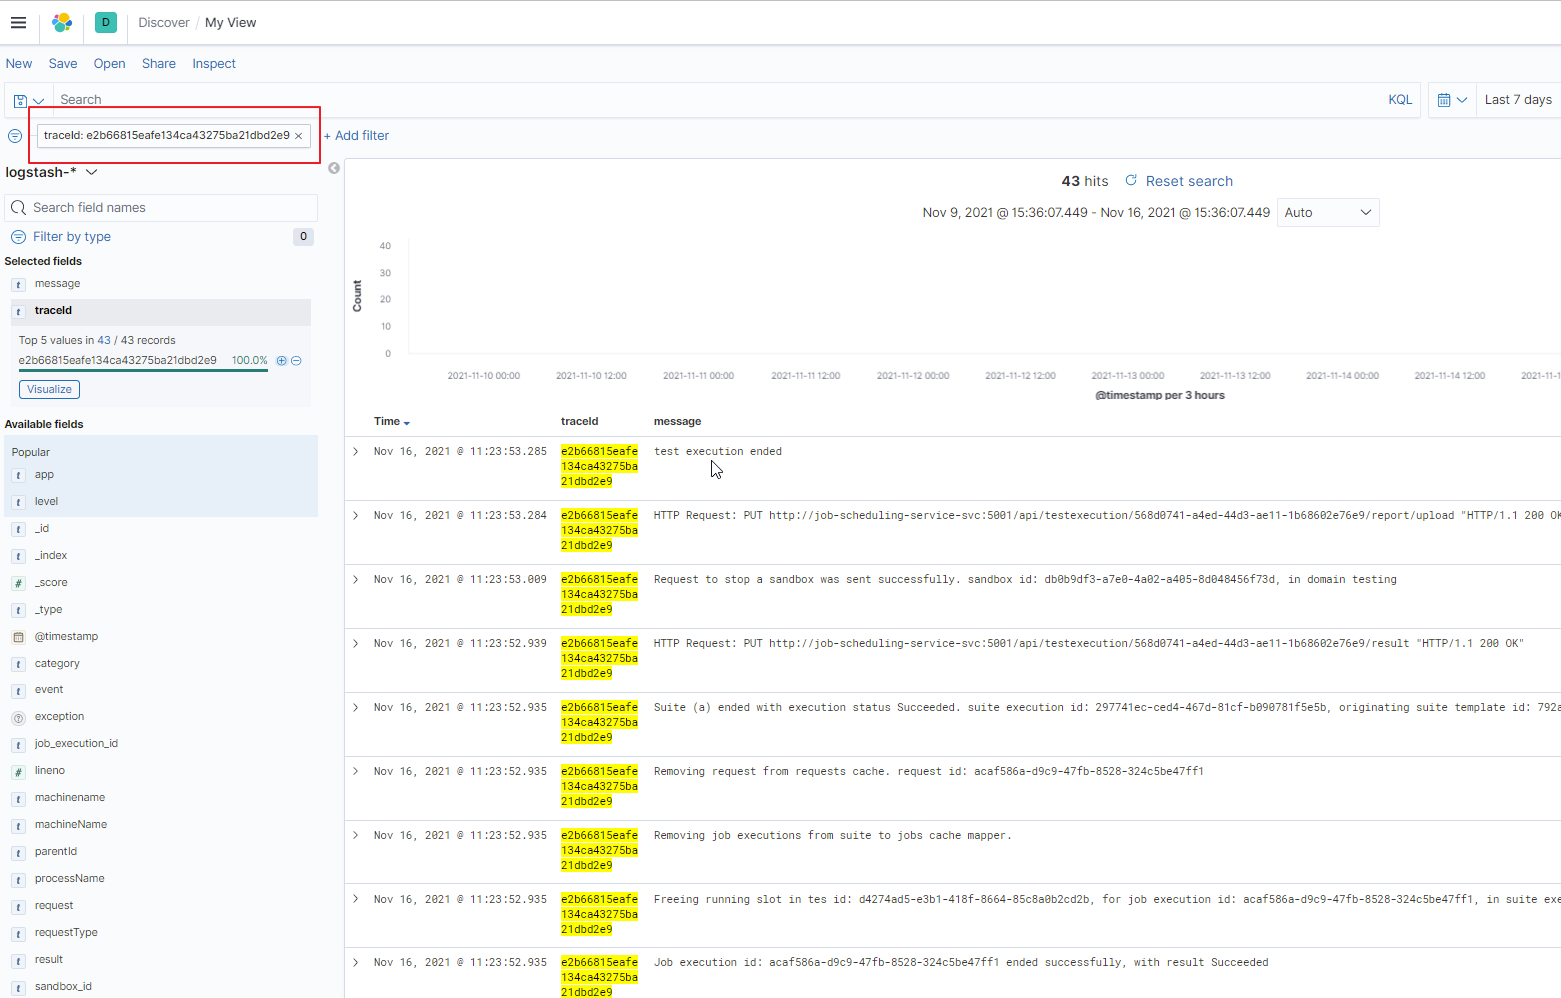
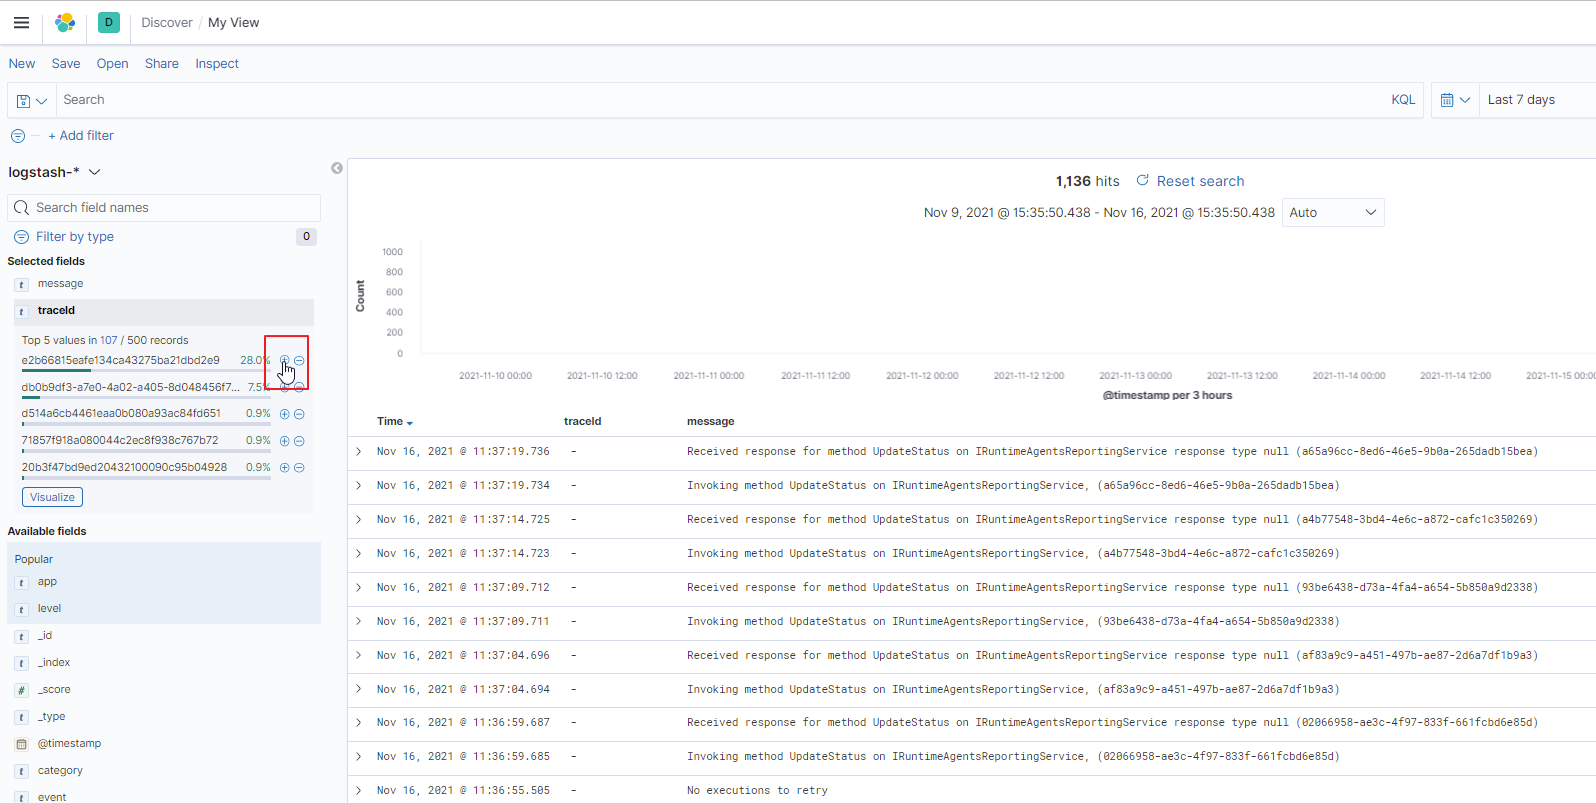
- To display log messages relating to a specific trace id, hover over the desired traceId and click the "+" button.
Messages for that trace id are displayed.
More...
More...