Activity Feed for an App in the sandbox
The Activity Feed pane enables you to display system messages and command execution progress for a specific App in the sandbox.
For information about the activity feed for a resource or service in the sandbox, see Activity Feed for a Resource in the Sandbox and Activity Feed for a service in the sandbox, respectively.
To open a component's Activity Feed:
-
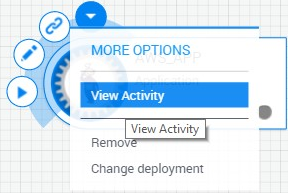
In the sandbox, click the component's live status icon. Alternatively, hover over the component and from the Actions menu, select View Activity.
The Activity Feed pane is displayed, listing the last 30 entries.
tipScroll to the bottom to display additional entries.
-
To change the time format of the entries, click the
 button. By default, the time elapsed is displayed for each entry.
 -
To narrow down your search for entries, use the search and filtering options. Click the
 button to show the filters.
Note that the search and filters apply to all entries in the Activity Feed, not just the last 30.
- Search feed field: search for entries that include a word, phrase or regex. For regex, start with a backtick - `. For example,
`resour*. - Error option: display errors that occurred in the sandbox
- Has output option: display entries that have an output
- Component drop down list: display entries that are related to a specific resource, App or service in the sandbox. The value Component displays entries for all components.
- Event type drop down list: display entries of a specific type. Values are: Event type (all entries), Command, Resource, Service and Sandbox.
- Search feed field: search for entries that include a word, phrase or regex. For regex, start with a backtick - `. For example,
For more detailed information about a particular error, see Activity Feed Pane.