Debugging Shell Driver Commands
While developing the Shell driver, you’ll probably need to debug it in order to troubleshoot issues or get actual results from the app/device to understand how the code behaves.
Debugging a 2nd Gen Shell
To debug our shell, we’ll use the mock Python open source package.
The mock package allows us to simulate the use of CloudShell and therefore is also useful for debugging early stage shells which are not yet ready to be installed on CloudShell. For example, you have not yet developed critical shell components, like communication with the device and auto-discovery, or you’re still developing the component or command you want to test, but are not sure what information the command will need.
Setting up
Create a new 2nd Gen shell project using Shellfoundry by running:
shellfoundry new mock-debug-shell --template gen2/resource
Preparing your environment
When running a shell command from within CloudShell, the CloudShell execution server creates a virtual environment for the shell and downloads the required Python dependencies automatically. However, since we will run the debug outside of CloudShell, you will also need to update your project’s runtime with the shell’s dependencies. We recommend creating a new virtual environment for the project, and then downloading the shell’s dependencies into the virtual environment.
If you’re using the PyCharm application, open the shell project folder, click Settings>Tools>Python Integrated Tools and in the Package requirements file field, specify the shell’s requirements.txt. For example: "C:\My Shells\debugging-example\src\requirements.txt".
Debugging the shell
In this section, we'll discuss two ways to debug a shell:
-
Using the mock debugger
-
Using an API token
Using the mock debugger
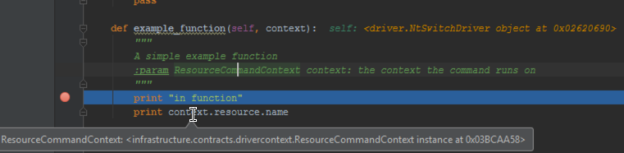
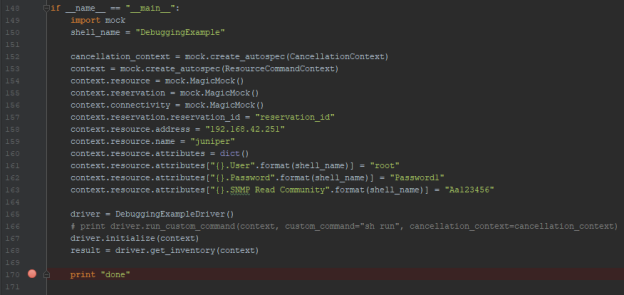
Add the following mock code to the shell, and specify some details, like reservation ID, resource address and name, and any attributes required for resource discovery (for example, User, Password and SNMP Read Community.)
if __name__ == "__main__":
    import mock
    from cloudshell.shell.core.driver_context import CancellationContext


    shell_name = "DebuggingExample"

    cancellation_context = mock.create_autospec(CancellationContext)
    context = mock.create_autospec(ResourceCommandContext)
    context.resource = mock.MagicMock()
    context.reservation = mock.MagicMock()
    context.connectivity = mock.MagicMock()
    context.reservation.reservation_id = "<RESERVATION_ID>"
    context.resource.address = "<RESOURCE_ADDRESS>"
    context.resource.name = "<RESOURCE_NAME>"
    context.resource.attributes = dict()
    context.resource.attributes["{}.User".format(shell_name)] = "<USER>"
    context.resource.attributes["{}.Password".format(shell_name)] = "<PASSWORD>"
    context.resource.attributes["{}.SNMP Read Community".format(shell_name)] = "<READ_COMMUNITY_STRING>"

    driver = DebuggingExampleDriver()

    # print driver.run_custom_command(context, custom_command="sh run", cancellation_context=cancellation_context)
    driver.initialize(context)
    result = driver.get_inventory(context)

    print "done"
Specify the attributes or commands you want to debug (result = line) and add your break points. For example:
And debug the shell. When debugging, the mock code will run instead of the shell’s default initialization commands and will call the commands you want to test. When shell development is finished, you can leave the mock code in the shell as CloudShell will ignore it.
For a step-by-step tutorial, see our instructional video on debugging with the mock package:
Using an API token
The below example gets the token from the context. Use it for driver commands/scripts running in CloudShell:
session = CloudShellAPISession(host=context.connectivity.server_address,
token_id=context.connectivity.admin_auth_token,
domain=context.reservation.domain)
It is also possible to run your unit tests using an authentication token, which provides the driver command with the required context objects from CloudShell. For example, injecting the authentication token into the connectivity object:
from cloudshell.api.cloudshell_api import CloudShellAPISession


host="localhost"
username="admin"
password="admin"
domain="Global"

pythonApi = CloudShellAPISession(host, username, password, domain)
print(pythonApi)

authToken = pythonApi.authentication.xmlrpc_token # Use "pythonApi.token_id" with cloudshell-automation-api version 2020.1.0.178672 and below
print(authToken)
connectivity.admin_auth_token = authToken
Debugging a 1st Gen Shell
In order to help with this process, we will use CloudShell’s Pycharm plugin, which provides debugging capabilities that you can use to attach to the driver process and debug it step by step.
Prerequisites
-
Install JetBrains PyCharm and CloudShell’s Pycharm plugin.
-
Have CloudShell set up. Have an execution server running on the same machine as your IDE.
Setting up
To test the debugging capabilities, create a new Shell project using ShellFoundry by running:
shellfoundry new debugging_example
cd debugging_example
Then create an instance of the DebuggingExample resource and add it to a sandbox so we can use it for testing. These steps are identical to the ones demonstrated in Getting Started with Shell Development, which you can use a reference.
Preparing your environment
As part of the generated shell project, a deployment.xml file has been automatically created. This file contains the mappings required for the PyCharm plugin to know where the source code is, what is the main driver class, what are the CloudShell credentials etc. Much of that information was automatically configured when we created the project using ShellFoundry.
There are a few things you do need to configure in order to use the plugin, mainly the CloudShell development server address and credentials. Fill in the following information in the XML file:
<!-- The address of the Quali server on which to deploy, mandatory -->
<serverRootAddress>serverlocation</serverRootAddress>

<!-- The port of the Quali server on which to deploy, defaults to "8029" -->
<port>8029</port>
<!-- The server admin username, password and domain to use when deploying -->
<username>user</username>
<password>password</password>
<domain>domain</domain>
Debugging
One of the problems with debugging Python code is that some IDEs such as PyCharm require the script file code the Python is running to be the same file in the same location as the file open in your IDE. When CloudShell is running the driver code it actually runs the version of the code that’s been uploaded to CloudShell on the execution server virtual environment. To solve this issue, you can set the runFromLocalProject attribute of the <Driver> element to ‘true’. This will change how CloudShell behaves and cause it to run the same file in your IDE instead. Please be aware that this is a development only setting and should not be used on your production environment.
<!-- The drivers to update, holds one or more drivers -->
<drivers>
   <!-- runFromLocalProject - Decides whether to run the driver from the current project directory for debugging purposes, defaults to "false" -->
   <!-- waitForDebugger - When `runFromLocalProject` is enabled, decides whether to wait for a debugger to attach before running any Python driver code, defaults to "false" -->
   <!-- sourceRootFolder - The folder to refer to as the project source root (if specified, the folder will be zipped and deployed instead of the whole project), defaults to the root project folder -->
    <driver runFromLocalProject="true" waitForDebugger="false" sourceRootFolder="src">
        <!-- A list of paths to the driver's files or folders relative to the project's root.
may be a path to a directory, in which case all the files and folders under the directory are added into the driver's zip file.
if the <sources> element is not specified, all the files under the project are added to the driver's zip file -->
        <sources>
             <source>src</source>
        </sources>
        <!-- the driver name of the driver to update -->
        <targetName>ModelExampleDriver</targetName>
    </driver>
</drivers>
Once you’ve set the runFromLocalProject attribute to true you’ll be able to use the IDE's Attach to Process feature to debug your code, set breakpoints etc.
One additional issue you may run into is that by the time you’re attaching to the Python process the command is already past the point you need to debug. In other words, the Python function doesn’t ‘wait’ for you to attach it. This can become critical if you need to debug the driver ‘initialize’ function or some basic setup code. To help solve that problem, there is another attribute you can choose to set called ‘waitForDebugger’. Setting that attribute to true will actually cause the driver to pause after its been launched, before even running the initialize function, and wait for a debugger to attach to it.
Testing out debugging
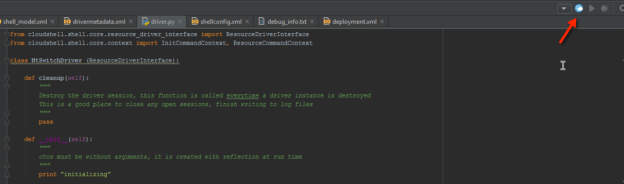
First, make sure you set both waitForDebugger and runFromLocalProject to true in the deployment.xml file. Then, add some code to the initialize as well as to some of the sample functions in the sample driver in our project. Once you’re done, click on the ‘CloudShell’ icon to deploy the driver in debug mode:
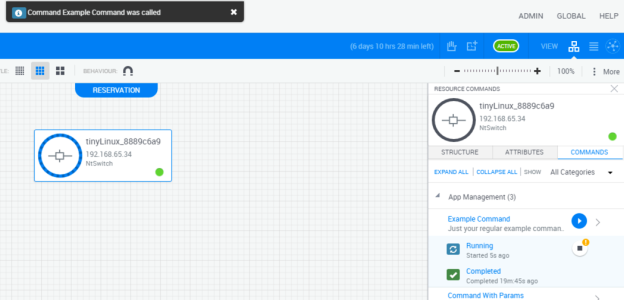
You can now run the function in CloudShell. You’ll notice it seems to be ‘stuck’ but what’s really happening behind the scenes is that the Python process is waiting for a debugger to attach to it in order to proceed.
Now set up a breakpoint in the initialize or in one of the other functions and run Run or Attach to local process (in PyCharm). Select the right Python process based on the path of the virtual environment, which will contain the driver name. Your IDE should transition to debug mode and you should be able to step over/into functions and access runtime data.